File:20210827 Global surface temperature bar chart - bars color-coded by El Niño and La Niña intensity.svg

Original file (SVG file, nominally 1,000 × 750 pixels, file size: 9 KB)
Captions
Captions
Summary[edit]
| Description |
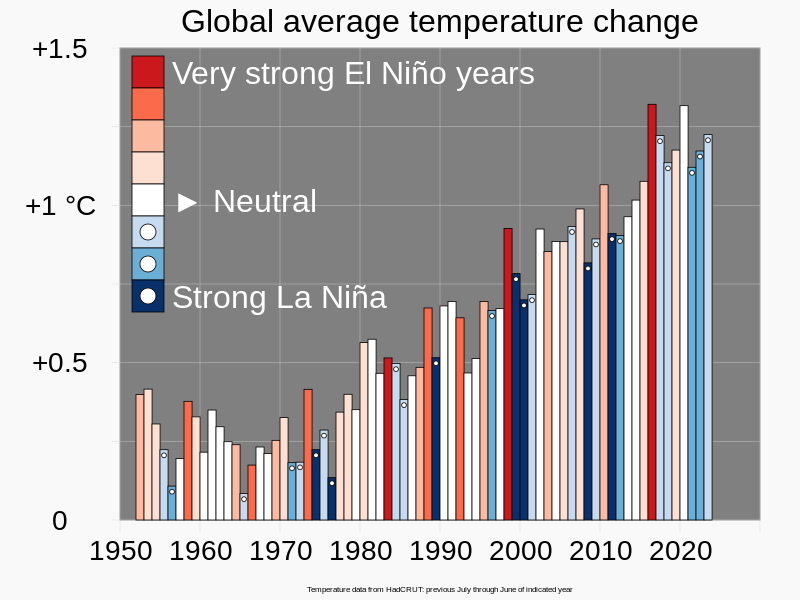
English: Bar chart of global surface temperature, with bars color-coded by El Niño and La Niña intensity.
Chart shows correlation of the (regional) El Niño–Southern Oscillation to global mean surface temperature. Suggested caption:
El Niño and La Niña intensity data is based on a year extending, roughly, from July of one year to June of the following year. Accordingly, I formed 12-month averages of global mean surface temperature anomalies from HadCRUT data extending from July to June, rather than the conventional calendar-year averaging. The height of each bar is determined by temperature change for that time period, and the color of the bar is determined by the El Niño and La Niña intensity category in that time period. The dark background, and black outlines of the individual bars, enable the colors to be seen more vividly. Circles were added to blue bars to help color-blind readers.
|
||
| Date | |||
| Source | Own work | ||
| Author | RCraig09 | ||
| Other versions |
Derivative works of this file: |


Licensing[edit]
- You are free:
- to share – to copy, distribute and transmit the work
- to remix – to adapt the work
- Under the following conditions:
- attribution – You must give appropriate credit, provide a link to the license, and indicate if changes were made. You may do so in any reasonable manner, but not in any way that suggests the licensor endorses you or your use.
- share alike – If you remix, transform, or build upon the material, you must distribute your contributions under the same or compatible license as the original.
File history
Click on a date/time to view the file as it appeared at that time.
| Date/Time | Thumbnail | Dimensions | User | Comment | |
|---|---|---|---|---|---|
| current | 18:32, 23 July 2023 | | 1,000 × 750 (9 KB) | RCraig09 (talk | contribs) | Version 8: MAJOR CHANGES: Adjusted temperature data to be measured with respect to "Pre-industrial levels" (1850-1900). Retained Japanese and Korean language translations in <switch> specifications |
| 14:03, 18 May 2023 |  | 1,000 × 750 (11 KB) | TAKAHASHI Shuuji (talk | contribs) | File uploaded using svgtranslate tool (https://svgtranslate.toolforge.org/). Added translation for ja. | |
| 08:38, 1 April 2023 |  | 1,000 × 750 (10 KB) | Aspere (talk | contribs) | File uploaded using svgtranslate tool (https://svgtranslate.toolforge.org/). Added translation for ko. | |
| 20:00, 30 January 2023 |  | 1,000 × 750 (8 KB) | RCraig09 (talk | contribs) | Version 5: update to include data through June 2022 | |
| 20:45, 27 November 2021 |  | 1,000 × 750 (8 KB) | RCraig09 (talk | contribs) | Version 4: moving dots near ends of bars to make it easier to see different influence bars . . . making SVG coding a bit more compact | |
| 20:43, 27 November 2021 |  | 1,000 × 750 (8 KB) | RCraig09 (talk | contribs) | Version 3: adding dots to La Nina bars for accessibility for color-blind people | |
| 05:32, 28 August 2021 |  | 1,000 × 750 (7 KB) | RCraig09 (talk | contribs) | Version 2: Clarify that HadCRUT provided temperature data only | |
| 02:02, 28 August 2021 |  | 1,000 × 750 (7 KB) | RCraig09 (talk | contribs) | Uploaded own work with UploadWizard |
You cannot overwrite this file.
File usage on Commons
The following 6 pages use this file:
File usage on other wikis
The following other wikis use this file:
- Usage on cs.wikipedia.org
- Usage on en.wikipedia.org
- Usage on en.wikiversity.org
- Usage on fa.wikipedia.org
- Usage on ja.wikipedia.org
- Usage on ko.wikipedia.org
- Usage on mk.wikipedia.org
- Usage on ru.wikipedia.org