Category:Agricultural diagrams
Jump to navigation
Jump to search
- See also
Subcategories
This category has the following 5 subcategories, out of 5 total.
Media in category "Agricultural diagrams"
The following 130 files are in this category, out of 130 total.
-
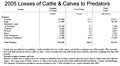 2005 Cattle Losses to Predators.jpg 1,707 × 937; 217 KB
-
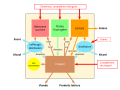
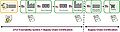
 Agribusiness Chain.png 956 × 684; 22 KB
-
 Agriculteurs à Querrieu.JPG 561 × 317; 37 KB
-
 Agricultural surplus.jpg 377 × 242; 28 KB
-
 Agriculture raisonnée.svg 1,042 × 512; 11 KB
-
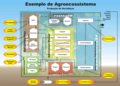 Agroecossistemas.png 1,024 × 730; 127 KB
-
-
 Anteile der Energiequellen an den Kraftantrieben der Landwirtschaft.jpg 1,031 × 694; 308 KB
-
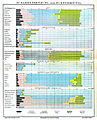
 Anwendungsumfang der Kartoffelerntetechnik.jpg 1,551 × 1,161; 536 KB
-
 Anwendungsumfang der Zuckerrübenerntetechnik.jpg 1,800 × 1,318; 629 KB
-
 Anwendungsumfang des maschinellen Melkens.jpg 1,000 × 581; 285 KB
-
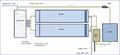
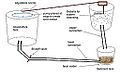 Aquaculture tank design 2nd edition.JPG 1,090 × 701; 80 KB
-
 Aratura g1.jpg 800 × 278; 62 KB
-
 Aratura g2.jpg 852 × 1,214; 112 KB
-
 Arbeitskraftaufwand bei Bodenbearbeitung und Aussaat.jpg 1,453 × 750; 180 KB
-
 Arbeitskraftaufwand bei der Getreideernte.jpg 1,054 × 749; 117 KB
-
 Arbeitskraftaufwand in der Halmfutterernte.jpg 1,078 × 737; 142 KB
-
 Arbeitskraftaufwand in der Kartoffelernte.jpg 1,057 × 707; 117 KB
-
 Arbeitskraftaufwand in der Zuckerrübenernte.jpg 1,109 × 707; 147 KB
-
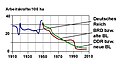 Arbeitskraftbesatz in der Landwirtschaft.jpg 1,244 × 662; 109 KB
-
 ASTI-DataTool-snapshot.jpg 800 × 506; 68 KB
-
 AufbauZEPP.png 552 × 512; 77 KB
-
 Ausstattung der Landwirtschaft in Deutschland mit Motor-PS.jpg 1,796 × 944; 225 KB
-
 Automatisches Melksystem.svg 760 × 600; 26 KB
-
 Banana yield Surinam.JPG 371 × 404; 21 KB
-
 Barbury Crop Circle en.PNG 387 × 355; 10 KB
-
 BarburyCastleBicycle.svg 402 × 362; 771 bytes
-
 Bestand an Zugtieren und Traktoren.jpg 1,239 × 581; 109 KB
-
 Betriebsgrößen in der Landwirtschaft.jpg 1,800 × 1,200; 215 KB
-
 Biotechpflanzen1.png 680 × 493; 80 KB
-
 Biotechpflanzen3.png 680 × 493; 140 KB
-
 Bocage-openfield.svg 754 × 500; 49 KB
-
 Briche système.svg 2,056 × 1,535; 56 KB
-
 Builenbrand cyclus (Ustilago maydis life cycle).jpg 2,426 × 1,906; 263 KB
-
 Central otago harvest.png 935 × 623; 12 KB
-
 Cereal storage diagram-fr.svg 1,600 × 1,200; 37 KB
-
 China-wheat-prod.png 711 × 426; 25 KB
-
 Clark's sector model.svg 511 × 302; 7 KB
-
 Crop rotation - cs.png 517 × 405; 85 KB
-
 Crop yield Guyana.JPG 370 × 424; 19 KB
-
 Cyclus Ustilago maydis.jpg 1,629 × 1,280; 98 KB
-
 Decline-of-the-worlds-wild-mammals.png 2,615 × 1,924; 269 KB
-
 Anteile bei der Bodenbearbeitung.jpg 997 × 711; 281 KB
-
 Drieslagstelsel.png 517 × 405; 70 KB
-
 Einsatz der landwirtschaftlichen Nutzflächen in Deutschland.jpg 1,356 × 621; 253 KB
-
 ElectrophyWeevil-cast.pdf 1,275 × 1,650; 516 KB
-
 Energy Balance.JPG 2,567 × 2,070; 362 KB
-
 Ertragsentwicklung bei Weizen und Kartoffeln.jpg 1,280 × 617; 83 KB
-
 Evolucio FAD.jpg 397 × 221; 47 KB
-
 FAB conceptual diagram.jpg 1,024 × 768; 252 KB
-
 Fallow.png 334 × 250; 2 KB
-
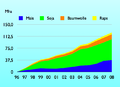
 Flaechenstillegung in Deutschland.jpg 3,054 × 1,875; 569 KB
-
 FMIB 32549 Rearing Pond.jpeg 1,151 × 744; 279 KB
-
 Zuteilung Zahlungsansprueche Kombimodell.png 960 × 720; 83 KB
-
 GlobalWaterFootprint by sector.1500.jpg 3,690 × 1,920; 348 KB
-
 GMOwektor.svg 600 × 610; 569 KB
-
 Grain Sorption Desorption graph-fr.svg 1,994 × 1,331; 17 KB
-
 Graphique Evolution Ta et Th d'un psychromètre.JPG 1,968 × 1,660; 360 KB
-
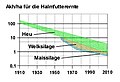
 Halmfutteraufkommen und Anteile der Konservate.jpg 1,097 × 1,276; 491 KB
-
 Hemispherical photography image manual rich 1989.pdf 1,275 × 1,650, 88 pages; 1.81 MB
-
 Humpolec, pivovar Bernard (27).jpg 5,184 × 3,456; 6.28 MB
-
 Humpolec, pivovar Bernard (28).jpg 5,184 × 3,456; 6.49 MB
-
 Humpolec, pivovar Bernard (29).jpg 3,456 × 5,184; 6.43 MB
-
 Humpolec, pivovar Bernard (30).jpg 3,456 × 5,184; 5.95 MB
-
 Humpolec, pivovar Bernard (31).jpg 5,184 × 3,456; 6.4 MB
-
 Humpolec, pivovar Bernard (32).jpg 5,184 × 3,456; 6.56 MB
-
 Humpolec, pivovar Bernard (33).jpg 5,184 × 3,456; 6.39 MB
-
 Irrigazione mesopotamica.svg 476 × 245; 11 KB
-
 Japan numbers of rotary tillers.PNG 559 × 320; 10 KB
-
 Japan tractor numbers.PNG 558 × 320; 10 KB
-
 La toile de la transition agricole et agroalimentaire 2021.jpg 12,467 × 7,411; 15.97 MB
-
 LCCS field protokoll.png 1,018 × 1,293; 3.89 MB
-
 Le compexeSPC.JPG 1,543 × 791; 149 KB
-
 LPCC-831-Cartell sobre blat de moro híbrid.jpg 1,758 × 1,122; 281 KB
-
 Meyers b6 s0806a.jpg 2,556 × 3,170; 7.17 MB
-
 Milkcontent.JPG 718 × 666; 76 KB
-
 Mowing around.png 253 × 253; 2 KB
-
 Mowing from one side.png 253 × 253; 2 KB
-
 Mowing from the centre.png 253 × 253; 2 KB
-
 Mowing reel mower.svg 744 × 1,052; 7 KB
-
 Mowing rotary mower.svg 744 × 1,052; 4 KB
-
 Mowing scythe or sickle.svg 744 × 1,052; 5 KB
-
 MudancadaTemperaturacomaLatitude.PNG 791 × 514; 22 KB
-
 Neuzulassungen und Bestand an Traktoren.jpg 1,422 × 710; 124 KB
-
 Nährstoffversorgung der Ackerflächen in Deutschland.jpg 1,105 × 694; 125 KB
-
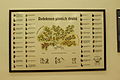
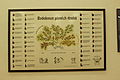
 Ogolna uprawa roli i roslin jako drzewo.jpg 584 × 804; 89 KB
-
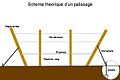 Palissage2.jpg 314 × 209; 8 KB
-
 Periodo.Vegetativo.Suíça.PNG 936 × 511; 21 KB
-
 Phosphorus Cycle copy.jpg 711 × 532; 82 KB
-
 Phosphorus cycle.png 538 × 304; 108 KB
-
 Plattegrond koffieplantage.jpg 554 × 725; 66 KB
-
 Produktivitätsveränderung12.JPG 917 × 314; 38 KB
-
 RAS Model 1.png 1,802 × 827; 66 KB
-
 RILs population construction.jpg 960 × 720; 102 KB
-
 Salinity before-after Egypt.JPG 513 × 262; 22 KB
-
 Schematic Overview of SCC.jpg 942 × 254; 63 KB
-
 Schweinezyklus.svg 1,061 × 639; 29 KB
-
 Shifting cultivation sustainable.svg 800 × 700; 19 KB
-
 Shifting cultivation unsustainable.svg 800 × 700; 24 KB
-
 Sistema Norfolk es.svg 817 × 629; 175 KB
-
 Sistema Norfolk.jpg 960 × 720; 77 KB
-
 Sistematrienal.png 897 × 497; 31 KB
-
 Sistematrienaldeculturas.png 677 × 552; 31 KB
-
 Soil texture chart.png 1,808 × 2,244; 83 KB
-
 Ssb-jordbruk.jpg 7,017 × 4,957; 1.26 MB
-
 Stickstoffaufnahme Getreide.svg 490 × 291; 18 KB
-
 Stockage cerales new.jpg 1,906 × 1,424; 380 KB
-
 Sugarcane yield Australia.JPG 335 × 400; 22 KB
-

-
 Tabelle bewässerte Flächen Weltweit.JPG 815 × 279; 30 KB
-
 Tabla 1 Textura del suelo.PNG 677 × 720; 28 KB
-
 Teeltwissel.PNG 600 × 400; 12 KB
-
 Thuenen-ringe.png 764 × 263; 9 KB
-
 Tierbestände und Milchertrag.jpg 1,298 × 562; 105 KB
-
 Total-AgResearch-Spending.jpg 254 × 184; 9 KB
-
 Total-Public-AgResearch-Spending.doc.jpg 472 × 627; 107 KB
-
 Tryjer bebnowy wolnobiezny.svg 320 × 210; 69 KB
-
 USDA and UK-ADAS textural triangle.jpg 1,056 × 834; 319 KB
-
 Ventilation grain Diagramme Carrier.svg 658 × 493; 39 KB
-
 Verfahrensanteile in der Getreideernte.jpg 1,694 × 715; 357 KB
-
 VMS Layout.GIF 793 × 626; 12 KB
-
 Weltagrarbericht01.jpg 968 × 711; 72 KB
-
 Welternte Mais, Reis, Weizen 1990–2016.png 1,513 × 923; 170 KB
-
 Welternten-Mais,-Reis,-Weizen-2011-BMK.jpg 842 × 595; 112 KB
-
 Wheat yield Egypt.JPG 417 × 396; 27 KB
-
 Wheat yield UK.JPG 380 × 391; 18 KB
-
 Wheat yields in selected countries, 1951-2004.png 649 × 544; 11 KB
-
 World grain production.gif 911 × 623; 12 KB
-
 World-wide grain yield.gif 911 × 623; 7 KB
-
 中国农业大学校史示意图.gif 520 × 541; 7 KB


_(19360903422).jpg)


.jpg)


.jpg)
.jpg)
.jpg)
.jpg)
.jpg)
.jpg)
.jpg)


_(14577535748).jpg)


